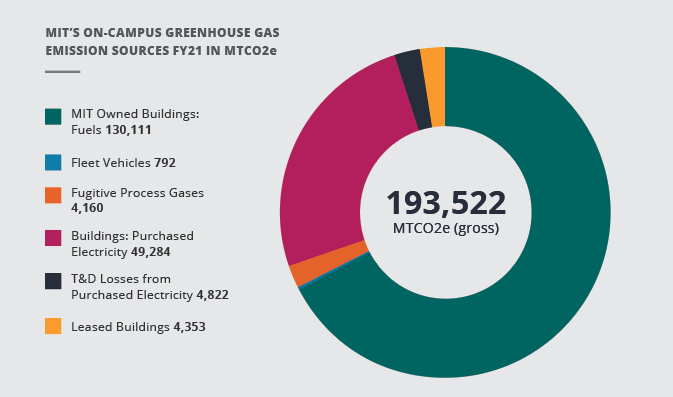
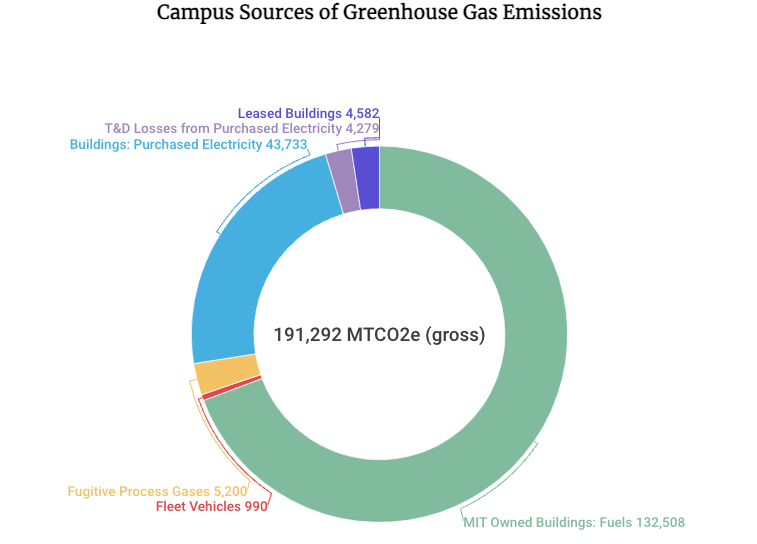
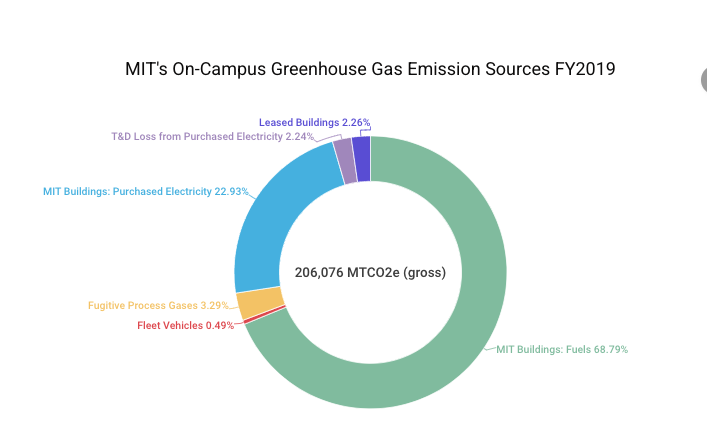
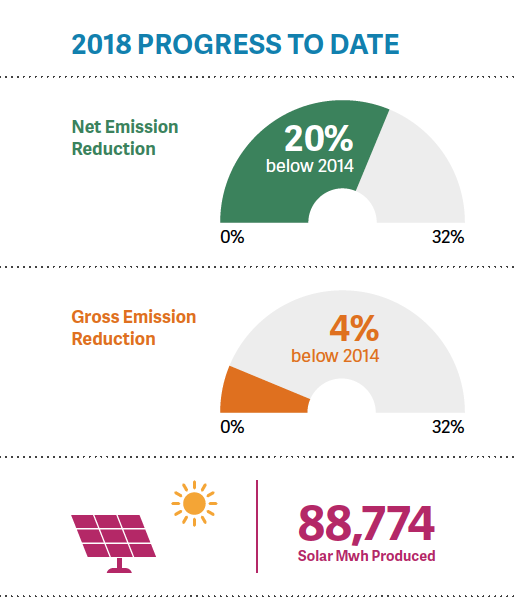
Each year, MIT measures the greenhouse gas emissions associated with the operation of our campus to better understand our direct contribution to the heat-trapping gases in the atmosphere – the gases contributing to global climate change. This basis informs our carbon reduction strategies and allows for tracking progress over time. In this section, you can explore emissions updates by year, from 2014 to 2019. Download an overview of 2014-2019 here.
MIT Greenhouse Gas Inventory 2014
FY2014 is the baseline year for the MIT emissions reduction goal and represents the first year of streamlined and comprehensive greenhouse gas data collection.
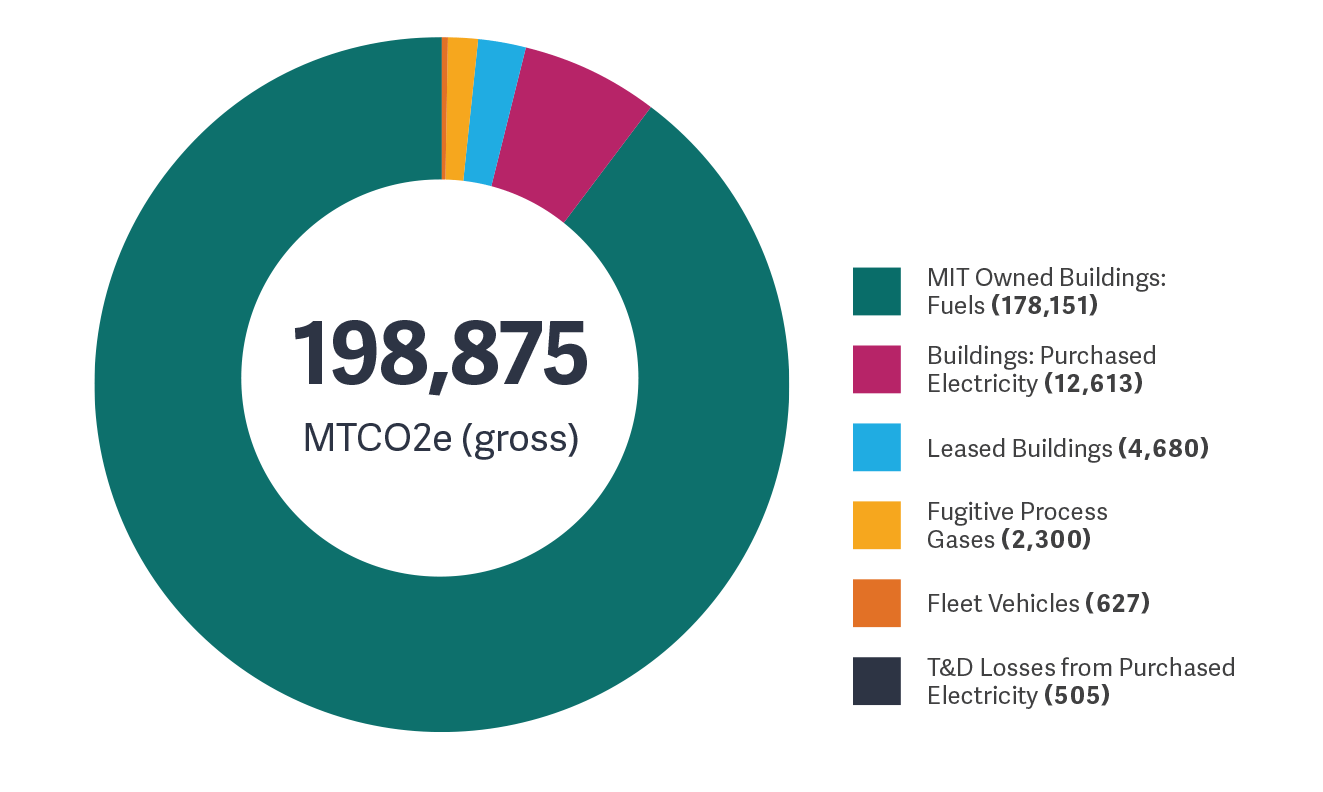
In FY2014, the largest source of campus emissions was the energy used to heat, cool, and power buildings. Ninety-eight percent of the Institute's emissions were associated with the operation of labs, offices, and other building facilities across campus. The inventory includes buildings owned and leased by MIT for research, teaching, and administrative purposes on the Cambridge campus. Leased space accounts for less than two percent of the total emissions. The 2014 inventory does not include MIT Investment Management Company (MITIMCo) properties outside of those leased to the Institute for campus use. Fugitive gas emissions and campus vehicle use comprised less than three percent of emissions.
MIT Greenhouse Gas Inventory 2015
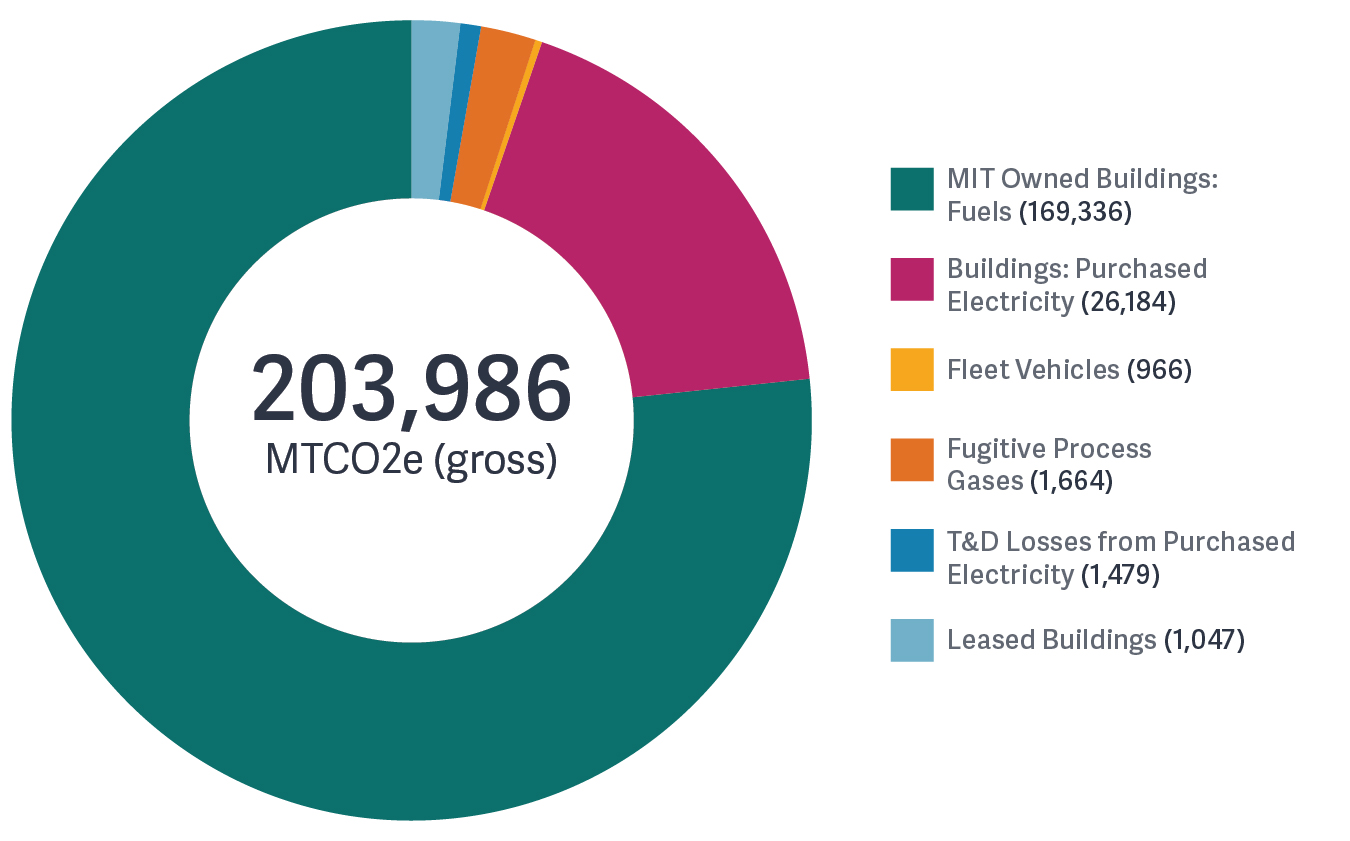
The 2015 inventory shows the results of the second year of comprehensive campus greenhouse gas emissions assessment. Ninety-seven percent of the Institute's emissions were associated with the operation of labs, offices, and other building facilities across campus. Fugitive gas emissions and campus vehicle use comprised two and one percent of campus emissions respectively. The total reduction in emissions is 12,408 MTCO2e from FY2014 to FY2015. The six percent reduction was primarily achieved through:
- The implementation of energy efficiency measures in buildings.
- Several buildings were partially or fully offline for renovation (Buildings 2, 66, and E52) during the period. These buildings will resume full operation in FY2016.
- Modest reductions attributed to weather variation.
MIT Greenhouse Gas Inventory 2016
After establishing its first campus-wide greenhouse gas reduction goal in 2015, MIT continued to measure its emissions while implementing reduction strategies, in pursuit of significantly lowering its carbon impact over time. For fiscal year 2016, MIT measured its greenhouse gas emissions from three areas (as it did in 2014 and 2015): owned & leased academic buildings, fugitive gases, and campus vehicles. Read the 2016 MIT News story here.
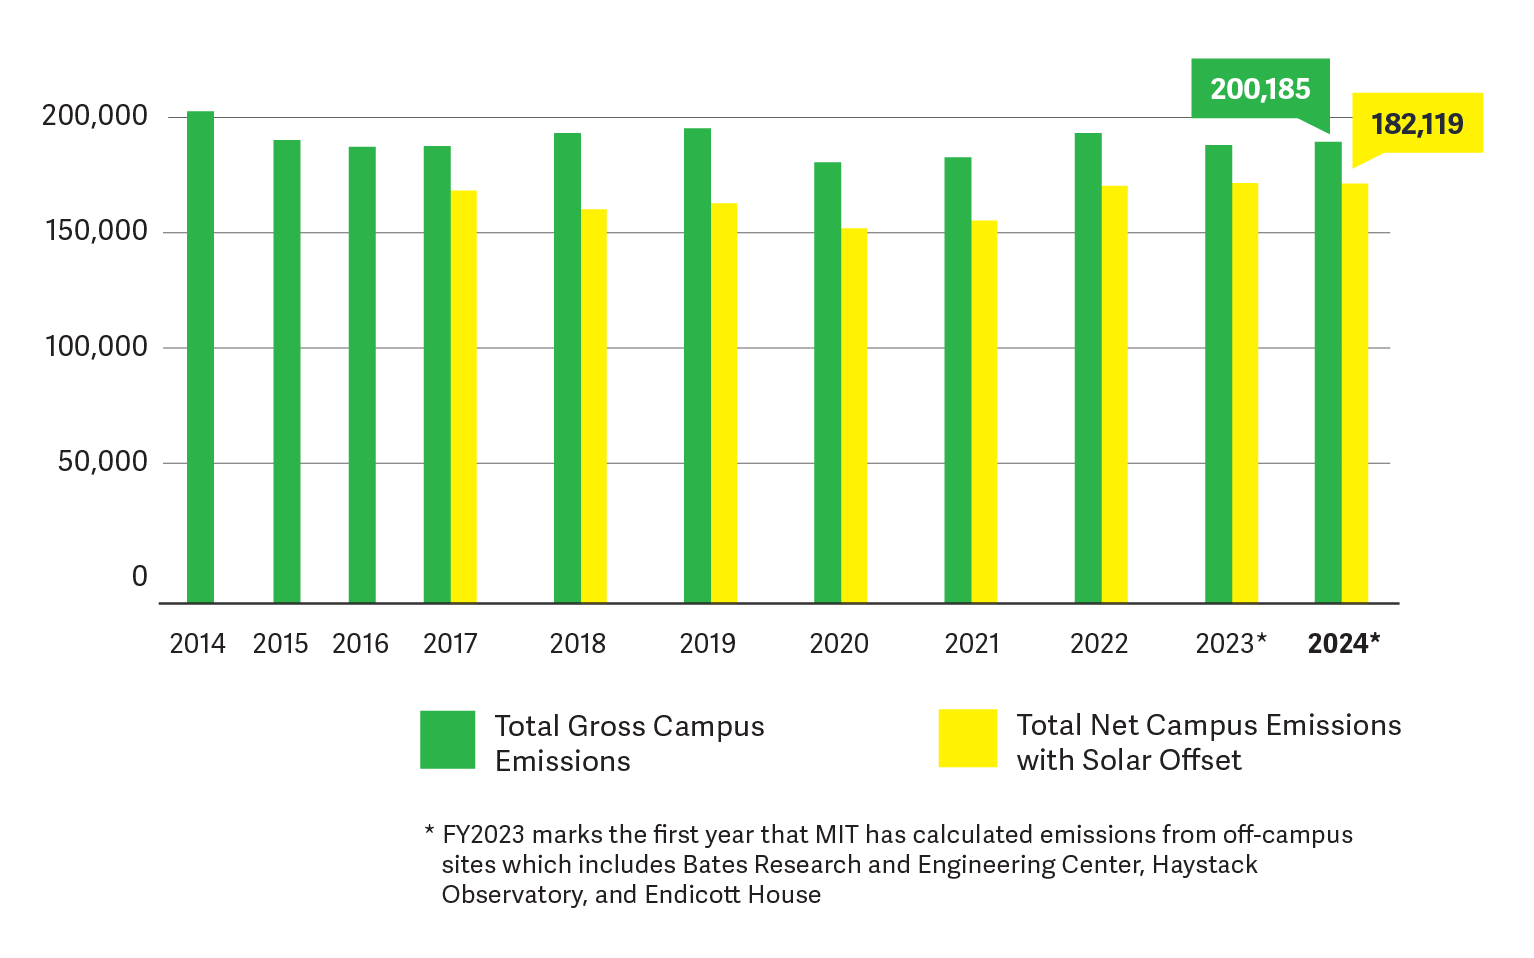
Since 2014 – MIT’s baseline year for its 32 percent reduction goal – total greenhouse gas emissions have declined, as the campus strives for carbon neutrality. Between FY2014 and FY2016, the campus achieved a 7 percent reduction in overall emissions: from 213,428 MTCO2e in FY2014 to 198,038 MTCO2e in FY2016. For FY2016, reductions in MIT’s own building emissions accounted for the vast majority of the total GHG reduced, followed by reductions in fugitive gases and fleet vehicle emissions. Ninety-seven percent of the Institute's emissions were associated with the operation of labs, offices, and other building facilities across campus. Fugitive gas emissions and campus vehicle use comprised two and one percent of campus emissions, respectively.
Reduction strategies
MIT reduced its GHG emissions between FY2014 and FY2016 through several strategies, including investments in energy efficiency, use of cleaner fuels, and improvements in grid-purchased electricity. Successful energy efficiency strategies included investments in new construction and renovation, lighting, building retro- and monitoring based-commissioning, mechanical system upgrades, and utility distribution system insulation.
Investments in energy efficiency continued to have a strong impact on the reduction of emissions. In FY2016 alone, MIT invested over $3 million in energy efficiency measures through its Efficiency Forward program, achieving an estimated 7,344,500 kWh savings of electricity and 700,000 therms of heating and cooling energy, generating an anticipated annual savings of over $1.5 million.
Looking forward, MIT recognizes that investing in renewable energy by deploying additional renewable energy systems on campus and enabling off-site renewable energy production is a key component of our plan. The Institute recently formed an alliance for the development of a 60 megawatt solar photovoltaic farm in North Carolina that led to a long-term power purchase agreement. MIT will purchase solar energy equivalent to 40 percent of its current electricity use, which will neutralize emissions by 17 percent.
MIT Greenhouse Gas Inventory 2017
From 2014-2017, MIT reduced its greenhouse gas emissions by 16 percent, making considerable progress toward the goal of reaching at least a 32 percent reduction by 2030, as called for in the Institute’s Plan for Action on Climate Change. Read the 2017 MIT News story on the progress here.
In FY2017, MIT’s greenhouse gas footprint has been reduced by 9% from 2016 levels primarily due to electricity produced via a solar power purchase agreement. MIT’s on-campus total emissions in 2017 were flat from 2016 levels. This is despite a growth in some campus emission sources combined with a colder winter, warmer summer and more carbon-intensive grid-purchased electricity.
2017 marked the first year MIT began to account for the impact of their large Summit Farm solar energy purchase. The newly developed Summit Farms solar farm began generating electricity for the North Carolina regional grid in November 2016; and through June 2017 produced 51,878 megawatt hours of power for MIT. It is expected that in a full-year of production, the solar farm will generate 107,000 megawatt hours of solar power for MIT.
Two additional milestones
The year 2017 saw the the launch of:

