Greenhouse Gas Inventory

Each year, MIT measures the greenhouse gas emissions associated with the operation of our campus to better understand our direct contribution to the heat-trapping gases in the atmosphere – the gases contributing to global climate change. This data informs our carbon reduction strategies and allows for tracking progress over time. 


Summary – Fiscal Year 2024

In fiscal year 2024, MIT reduced its total building-related on-campus emissions by 3 percent from the previous year, even after the addition of the new Schwarzman College of Computing and Tina and Hamid Moghadam Building. This reduction in emissions is largely attributed to energy efficiency projects targeting multiple campus buildings.

MIT’s Summit Farms solar power purchase agreement (PPA) enabled the Institute to offset 9 percent of its total on-campus emissions in fiscal year 2024.  Including all sources of campus emissions and the impact ofthe PPA, MIT’s emissions in 2024 were 15 percent below the total 2014 baseline, despite significant growth in campus facilities, including MIT.nano and many others.

2024 Emissions Sources

emissions sources year over yeaar

2024 Emissions Totals

bar chart of emissions year over year

Download a PDF of the full 2024 Report


Previous GHG summaries and Methodology

2023

In fiscal year 2023, there was a 2.4 percent reduction in building-related on-campus emissions over the previous year. Including all sources of campus emissions, as well as the impact of MIT’s current solar power purchase agreement (PPA), MIT’s net emissions in 2023 were 14 percent below the 2014 baseline. 

The reduction of campus emissions can be attributed to the first full-year of operation of MIT’s new cogeneration plant combined with several completed building-level energy efficiency projects. As the Institute has set a goal of campus decarbonization by 2050, stakeholders continue to lay the groundwork to accelerate campus decarbonization efforts through additional novel approaches. In the near-term, the Institute continues progress toward its 2026 goal of seeking a net-zero campus.

Alongside the efforts on campus, MIT is leading work with a number of partners to spur the creation of multiple large-scale renewable energy projects, including wind and solar. These projects will  have an immediate and significant impact of reducing emissions through the urgently-needed decarbonization of regional power grids.

donut chart of campus emissions sources

Download the full 2023 Report

2022

Progress toward decarbonizing a dynamic campus like MIT highlights the often-non-linear path of reducing emissions. As the campus grows and needs evolve, emissions fluctuations are both expected and managed for, but the ultimate goal of a zero emissions MIT—and the work toward it—remains unchanged.  In fiscal year 2022, there was a 5% increase in total on-campus emissions over the previous year. In this same time, MIT’s solar power purchase agreement (PPA) in North Carolina enabled the Institute to offset 11% of its total on-campus emissions.  

The overall increase in energy demand on campus—and resulting increase in emissions—was driven in part by a repopulation of campus, new campus growth (related to the New Vassar, the MIT Museum, expansion of Building 4, and reopened Hayden Library), pandemic related safety measures, such as higher building ventilation rates, and testing energy required for the new central plant commissioning. In addition, less solar energy was produced through our North Carolina solar PPA in fiscal year 2022, contributing to an increase in MIT’s total net emissions. MIT continues to focus on reducing direct energy use and the resulting emissions as the campus transforms and grows to meet the mission of the Institute.  

This year MIT committed to its fourth, multi-year partnership agreement with local utility company Eversource. The program—known as Efficiency Forward—was designed in 2010 to create an enhanced energy efficiency incentive program, creating a win-win situation where MIT could invest in more energy conservation projects and lower energy consumption on campus. Since its inception, the program has executed nearly 300 projects for a total calculated savings of approximately 70 million kilowatt hours and 4.2 million therms, playing a key role in MIT’s goal to reduce overall carbon emissions.

Despite a 7.5 percent increase in MIT’s campus building space since 2014 (equivalent to growth of 1 million gross square feet) the Institute reduced campus emissions over the same period by 5 percent via building energy retrofits and other efficiency measures, fuel switching from oil to natural gas and grid improvements. Including the impacts from solar energy purchases, MIT has reduced its net emissions by 15 percent since 2014. 

donut chart of emissions sources

Download the full 2022 Report

2021

In 2021, MIT’s greenhouse gas (GHG) emissions remained relatively flat, with emissions rising approximately 2% from 2020 levels. This slight increase was driven in part by the addition of new buildings and pandemic-related building safety measures that ultimately required higher energy consumption. However, these higher emissions were offset through building-level energy efficiency investments, operational efficiency of the Central Utilities Plant (CUP), and improvements in the New England regional electricity grid. Since 2014, MIT has reduced its net emissions by approximately 22%. Of that net reduction achieved to date, approximately 13% is attributed to our solar power purchase agreement, 8% to on-campus mitigation measures, and less than 1% to carbon improvements to the local electricity grid. This sets MIT on the path toward the newly announced 2026 goal of net-zero emissions.


Download the full 2021 Report

2020

In 2020, MIT continued to advance toward its goal of a minimum 32% reduction in greenhouse gas (GHG) emissions by 2030. Overall net emissions are now 24% below MIT’s 2014 baseline, with emissions on campus reduced 6% over the previous fiscal year. This reduction was driven in part by gains in building-level energy efficiency investments, operational efficiency of the Central Utilities Plant (CUP), improvements in the New England regional electricity grid, a less intense heating season, and a temporary de-densification of campus due to COVID-19.

Sources of Reduced Emissions
In FY20, MIT realized a net reduction of nearly 11,000 metric tons of GHG emissions from the previous year. These net changes were driven by several primary factors as highlighted below. Preliminary efforts to develop data on the Institute’s Scope 3, or indirect, GHG emissions continue. This data will inform MIT’s total GHG emissions activities and enable MIT to explore opportunities to reduce emissions beyond what is currently being tracked.

donut chart of emissions sources

Download the full 2020 Report

2019

Recap for 2019
In 2019, MIT continued to advance toward its goal of a minimum 32% reduction in greenhouse gas (GHG) emissions by 2030. Overall net emissions are 18% below our 2014 baseline as on-campus greenhouse gas emissions increased slightly from 2018 levels. This 2% increase in 2019 was in part driven by growth in campus size—including the first fully operational year for MIT.nano—local weather, and the use of specialty research gases. Investments in energy efficiency projects offset a portion of the growth in energy demand.

Innovating for GHG Mitigation 
MIT is home to numerous lab facilities where energy consumption is typically high due to the conditioning of outside air for ventilation purposes, coupled with high air change rates. MIT is currently exploring the development of an innovative laboratory ventilation procedure program to minimize energy consumption while also ensuring the safety and integrity of lab experimentation. The use of specialty gases in research across campus contributes a small yet potent  source of greenhouse gas emissions at MIT. As MIT.nano is expected to use substantial amounts of these gases, the research facility is testing a new system to neutralize these emissions through abatement solutions at point of use — reducing emissions and providing a model for altering the emissions potential of similar research and manufacturing facilities around the world.

Summit Farms Solar Facility 
MIT continued to benefit from the Institute’s 25-year commitment to purchase electricity generated through its Summit Farm Power Purchase Agreement (PPA). The agreement has enabled the construction of a roughly
650-acre, 60-megawatt solar farm on fallow farmland in North Carolina. Through the purchase of 87,300 megawatt hours of solar power, MIT was able to offset over 30,000 metric tons of greenhouse gas emissions (MTCO2e) from our
on-campus operations in 2019. The Summit Farms PPA model has been credited with inspiring a number of similar projects around the country putting additional renewable energy onto the power grid.

Energy Efficiency
As MIT explores strategies for achieving climate neutrality in the future, a core component continues to be scaling up campus energy efficiency. Anchored by significant planned efficiency gains from MIT’s new central utility plant, the Institute is implementing new complementary approaches to increase energy efficiency gains in buildings ranging from testing artificial intelligence to optimize building control systems, to wholesale mechanical system changes in labs to reduce air change requirements creating a more efficient and comfortable work environment.

donut chart of emissions sources

Download the full 2019 Report

2018

Recap for 2018
MIT continues to advance towards its 2015 goal of a 32% reduction in campus greenhouse gas emissions by 2030. Compared to 2017, net emissions, which account for the offset by the solar power purchase, have fallen 4.5%, bringing the total net emissions reduction to 20% below our 2014 baseline. Although on-campus gross emissions (which do not account for the solar energy purchase) increased 3% from 2017 to 2018, these emissions have dropped a total of 4% since 2014. Read the MIT News story here for more insight into this progress.

Solar energy purchase agreement update
Through the solar energy purchase agreement, Summit Farms produced 88,774 megawatt hours for MIT in 2018, contributing a net carbon offset of 33,040 metric tons carbon dioxide equivalent (MTCO2e). The power purchase agreement partnership between MIT, Boston Medical Center and Post Office Square, continues to be viewed as an important and scalable multi-party model for other organizations.

A deeper dive into the sources of MIT's emissions
In 2018 the largest source of MIT's greenhouse gas emissions is associated with the energy to heat, cool, and power our buildings. This is followed by the use of specialty gases that are used in research and operations, and then emissions associated with leased academic space, emissions associated with the transmission and distribution losses of purchased grid electricity, and lastly, emissions from use of fuel in MIT's fleet of campus vehicles.

A note about gross campus emissions
In 2018, gross emissions from all on-campus sources grew slightly from the previous year. This can be attributed to a colder than usual winter, changes in efficiency within the central utility plant, and growth in energy use on campus including new construction. Since 2014, the size of MIT’s campus within the boundaries of our GHG inventory has increased by 2%. When emissions reductions resulting from MIT's purchase of solar energy are taken into account, MIT's net greenhouse gas emissions continued to decline. Read the 2018 GHG summary report below for more details.

progress infographic

Download the full 2018 Report

Emissions overview 2014 - 2017

Each year, MIT measures the greenhouse gas emissions associated with the operation of our campus to better understand our direct contribution to the heat-trapping gases in the atmosphere – the gases contributing to global climate change. This basis informs our carbon reduction strategies and allows for tracking progress over time. In this section, you can explore emissions updates by year, from 2014 to 2019. Download an overview of 2014-2019 here. 


MIT Greenhouse Gas Inventory 2014
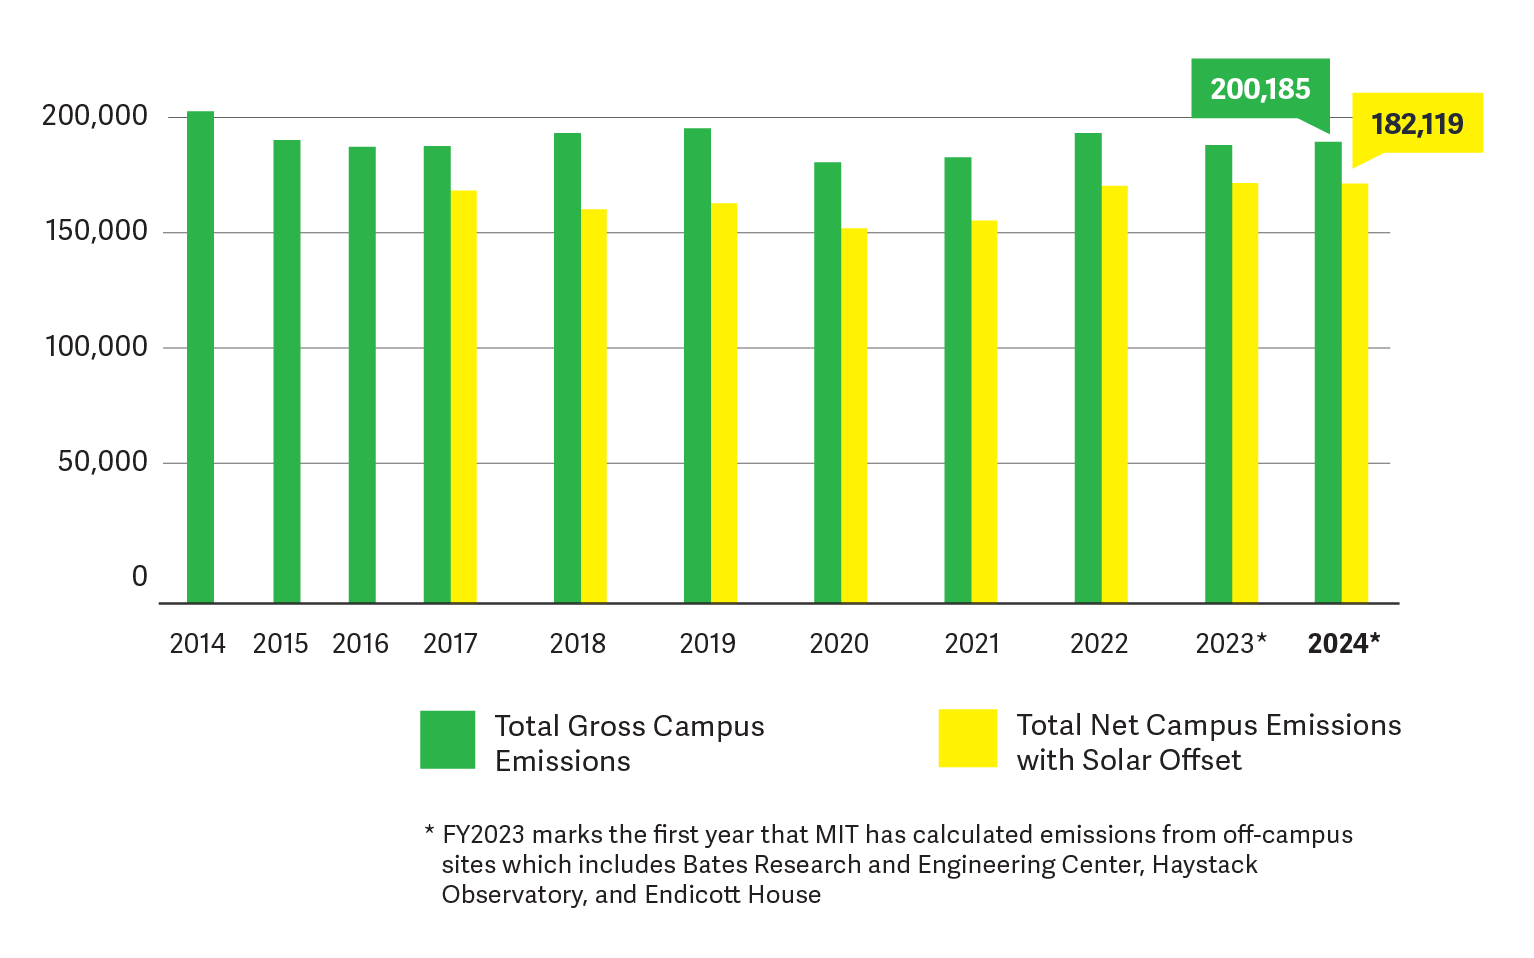
FY2014 is the baseline year for the MIT emissions reduction goal and represents the first year of streamlined and comprehensive greenhouse gas data collection.

In FY2014, the largest source of campus emissions was the energy used to heat, cool, and power buildings. Ninety-eight percent of the Institute's emissions were associated with the operation of labs, offices, and other building facilities across campus. The inventory includes buildings owned and leased by MIT for research, teaching, and administrative purposes on the Cambridge campus. Leased space accounts for less than two percent of the total emissions. The 2014 inventory does not include MIT Investment Management Company (MITIMCo) properties outside of those leased to the Institute for campus use. Fugitive gas emissions and campus vehicle use comprised less than three percent of emissions.


MIT Greenhouse Gas Inventory 2015 
The 2015 inventory shows the results of the second year of comprehensive campus greenhouse gas emissions assessment. Ninety-seven percent of the Institute's emissions were associated with the operation of labs, offices, and other building facilities across campus. Fugitive gas emissions and campus vehicle use comprised two and one percent of campus emissions respectively. The total reduction in emissions is 12,408 MTCO2e from FY2014 to FY2015. The six percent reduction was primarily achieved through:

  • The implementation of energy efficiency measures in buildings.
  • Several buildings were partially or fully offline for renovation (Buildings 2, 66, and E52) during the period. These buildings will resume full operation in FY2016.
  • Modest reductions attributed to weather variation.

MIT Greenhouse Gas Inventory 2016

After establishing its first campus-wide greenhouse gas reduction goal in 2015, MIT continued to measure its emissions while implementing reduction strategies, in pursuit of significantly lowering its carbon impact over time. For fiscal year 2016, MIT measured its greenhouse gas emissions from three areas (as it did in 2014 and 2015): owned & leased academic buildings, fugitive gases, and campus vehicles. Read the 2016 MIT News story here.

Since 2014 – MIT’s baseline year for its 32 percent reduction goal – total greenhouse gas emissions have declined, as the campus strives for carbon neutrality. Between FY2014 and FY2016, the campus achieved a 7 percent reduction in overall emissions: from 213,428 MTCO2e in FY2014 to 198,038 MTCO2e in FY2016.  For FY2016, reductions in MIT’s own building emissions accounted for the vast majority of the total GHG reduced, followed by reductions in fugitive gases and fleet vehicle emissions. Ninety-seven percent of the Institute's emissions were associated with the operation of labs, offices, and other building facilities across campus. Fugitive gas emissions and campus vehicle use comprised two and one percent of campus emissions, respectively.


Reduction strategies
MIT reduced its GHG emissions between FY2014 and FY2016 through several strategies, including investments in energy efficiency, use of cleaner fuels, and improvements in grid-purchased electricity. Successful energy efficiency strategies included investments in new construction and renovation, lighting, building retro- and monitoring based-commissioning, mechanical system upgrades, and utility distribution system insulation.

Investments in energy efficiency continued to have a strong impact on the reduction of emissions. In FY2016 alone, MIT invested over $3 million in energy efficiency measures through its Efficiency Forward program, achieving an estimated 7,344,500 kWh savings of electricity and 700,000 therms of heating and cooling energy, generating an anticipated annual savings of over $1.5 million.

Looking forward, MIT recognizes that investing in renewable energy by deploying additional renewable energy systems on campus and enabling off-site renewable energy production is a key component of our plan. The Institute recently formed an alliance for the development of a 60 megawatt solar photovoltaic farm in North Carolina that led to a long-term power purchase agreement. MIT will purchase solar energy equivalent to 40 percent of its current electricity use, which will neutralize emissions by 17 percent. 


MIT Greenhouse Gas Inventory 2017

From 2014-2017, MIT reduced its greenhouse gas emissions by 16 percent, making considerable progress toward the goal of reaching at least a 32 percent reduction by 2030, as called for in the Institute’s Plan for Action on Climate Change. Read the 2017 MIT News story on the progress here.

In FY2017, MIT’s greenhouse gas footprint has been reduced by 9% from 2016 levels primarily due to electricity produced via a solar power purchase agreement. MIT’s on-campus total emissions in 2017 were flat from 2016 levels. This is despite a growth in some campus emission sources combined with a colder winter, warmer summer and more carbon-intensive grid-purchased electricity.

2017 marked the first year MIT began to account for the impact of their large Summit Farm solar energy purchase. The newly developed Summit Farms solar farm began generating electricity for the North Carolina regional grid in November 2016; and through June 2017 produced 51,878 megawatt hours of power for MIT. It is expected that in a full-year of production, the solar farm will generate 107,000 megawatt hours of solar power for MIT.

Two additional milestones
The year 2017 saw the the launch of:

  • Energize MIT - our on-line energy and GHG data dashboard available to the MIT community – is calculating and displaying for the MIT community our academic building GHG performance on a monthly basis. These emissions comprise 94% of all the emissions we are tracking for our 2030 reduction goal. Explore this data at Energize MIT.
  • MIT's first greenhouse gas emissions reduction strategy report, reflecting implementation priorities for the next 3-5 years.


Methodology

A greenhouse gas inventory assesses the quantity of greenhouse gases the Institute produces, and identifies the emissions’ sources. The MIT Office of Sustainability (MITOS) uses the Operational Control Approach as defined by the World Resources Institute’s GHG Protocol, the worldwide corporate and campus standard for greenhouse gas emissions measurement. The GHG Protocol defines emissions using three "scopes," which are detailed below along with the specific greenhouse gases measured.

MIT currently measures emissions from owned & leased academic buildings, fugitive gases, and campus vehicles. The emissions from these activities are calculated using the Greenhouse Gas Protocol embedded in the original Campus Carbon Calculator — the most commonly used inventory tool for universities — which converts data into a single unit: metric tons of carbon dioxide equivalent (MTCO2e).

MITOS conducts and manages the annual inventories in collaboration with the Department of Facilities and the Environment, Health and Safety Office. The MIT Office of Treasury and Planning audits the findings for accuracy. MIT plans to expand the scope of its GHG inventory in the future and actively engage the academic and operational community in the use, refinement, and application of the inventory in order to reduce the carbon intensity of the campus.