MIT’s Greenhouse Gas Inventory

GHG Introduction

MIT's Greenhouse Gas Inventory

Each year, MIT measures the greenhouse gas emissions associated with the operation of our campus to better understand our direct contribution to the heat-trapping gases in the atmosphere – the gases contributing to global climate change. This basis has long informed our carbon reduction strategies and allows for tracking progress over time. 
 

MIT Greenhouse Gas Emissions

total emissions year over year

Summary – Fiscal Year 2023 

In fiscal year 2023, there was a 2.4 percent reduction in building-related on-campus emissions over the previous year. Including all sources of campus emissions, as well as the impact of MIT’s current solar power purchase agreement (PPA), MIT’s net emissions in 2023 were 14 percent below the 2014 baseline. 
 
The reduction of campus emissions can be attributed to the first full-year of operation of MIT’s new cogeneration plant combined with several completed building-level energy efficiency projects. As the Institute has set a goal of campus decarbonization by 2050, stakeholders continue to lay the groundwork to accelerate campus decarbonization efforts through additional novel approaches. In the near-term, the Institute continues progress toward its 2026 goal of seeking a net-zero campus.

Alongside the efforts on campus, MIT is leading work with a number of partners to spur the creation of multiple large-scale renewable energy projects, including wind and solar. These projects will  have an immediate and significant impact of reducing emissions through the urgently-needed decarbonization of regional power grids.


More about MIT’s greenhouse gas inventory

The current inventory includes emissions associated with three primary sources: owned and leased buildings, specialty research and process gases, and campus vehicles. In May 2021 MIT released its latest climate action plan, Fast Forward: MIT’s Climate Action Plan for the Decade, outlining the ambitious goals to achieve net-zero campus carbon emissions by 2026 and eliminate all direct emissions by 2050.

Scope 3 Emissions

In 2019, the MIT Office of Sustainability (MITOS) expanded upon a multi-year effort to build a preliminary picture of the Institute’s Scope 3, or indirect, GHG emissions. This is done to inform MIT’s total greenhouse gas emissions activities (Scopes 1 + 2 + 3) and explore where strategic opportunities may exist to reduce emissions beyond what MIT is currently tracking. This effort is developing additional emissions data associated with MIT’s purchased goods and services, MIT-sponsored travel, commuting, and capital goods (furniture, fixtures, tools, etc.) using the WRI & WBCSD GHG Protocol for Scope 3 framework.

The Role of Summit Farms Solar Power Purchase

Summit Farms Solar LLC is a solar photovoltaic facility in Currituck County North Carolina, operated by Dominion Energy. MIT has contracted through a long-term power purchase agreement for the purchase of 73% of the electricity produced. MIT has chosen to retire the renewable energy credits associated with the purchase.

solar ppa

The offsets produced by Summit Farms’ clean, emissions-free power are clear and tangible. The solar facility displaces more carbon-intensive sources of energy, in a region where forty percent of its power is generated from coal. In addition to displacing power, the solar farm has helped to facilitate the early retirement of a large coal-fired plant nearby, by providing substitute power to make up for the coal plant’s contractual peak-power delivery obligations. The owners of the coal plant are paying the purchasing partners (that include MIT) to provide substitute capacity as they come offline, making it economically feasible for the coal plant to retire ahead of schedule.

MIT Greenhouse Gas Inventory Resources
a screenshot of a two page brochure
2023 GHG Summary Report

A two-page information resource on progress towards MIT's Greenhouse Gas Goal in 2023.

open PDF of the brochure
2022 GHG Summary Report

A two-page informational handout on MIT's progress towards the GHG goal.

screenshot of brochure cover
2021 GHG Summary Report

A two-page information resource on progress towards MIT's Greenhouse Gas Goal in 2021.

2019 GHG summary
2014-2020 GHG Data

Download underlying energy and greenhouse data.

GHG Inventory
MIT GHG Inventory Overview

Learn more about our methodology and performance since 2014.

aerial image of MIT dome with batter illustration imposed over
Energize_MIT

Energize_MIT is an open energy data tracking tool supporting operational decision-making and research.

Load more

2023 GHG Update

Decarbonizing MIT

In fiscal year 2023, there was a 2.4 percent reduction in building-related on-campus emissions over the previous year. Including all sources of campus emissions, as well as the impact of MIT’s current solar power purchase agreement (PPA), MIT’s net emissions in 2023 were 14 percent below the 2014 baseline. 
 
The reduction of campus emissions can be attributed to the first full-year of operation of MIT’s new cogeneration plant combined with several completed building-level energy efficiency projects. As the Institute has set a goal of campus decarbonization by 2050, stakeholders continue to lay the groundwork to accelerate campus decarbonization efforts through additional novel approaches. In the near-term, the Institute continues progress toward its 2026 goal of seeking a net-zero campus.

Alongside the efforts on campus, MIT is leading work with a number of partners to spur the creation of multiple large-scale renewable energy projects, including wind and solar. These projects will  have an immediate and significant impact of reducing emissions through the urgently-needed decarbonization of regional power grids.
 

MIT Greenhouse Gas Emissions Sources, FY2023

ghg sources 2023

Retrofits and Pilots
Large-scale building efficiency projects are essential to MIT reducing its campus emissions. This past year, Building 46 (Brain and Cognitive Sciences Complex)—one of the top energy consumers on campus—underwent work toward a planned energy reduction of 35 percent, which is anticipated to reduce total campus emissions by 2 percent. The effort reached all 1,254 spaces in the research and office building and optimized ventilation, converted fume hoods from constant volume to variable volume, and installed equipment to help the building systems run more efficiently.
 
Energy efficiency work also launched in Building 68 (David H. Koch Biology Building), another top energy consumer on campus. Each building efficiency project begins with an energy assessment, and with the Building 68 assessment, it was quickly identified that the building’s existing heat recovery system wasn’t working optimally. A team representing Campus Construction, Engineering & Energy Management, and Campus Services & Maintenance joined forces to optimize the system operation, and achieve significant heating energy reduction over the last 12 months.
 
AI Building Controls
In 2023, researchers in partnership with staff from the Department of Facilities and the Office of Sustainability began piloting artificial intelligence that works with existing building management systems to support dynamic heating and cooling of individual campus spaces to lower energy use and emissions in buildings. Researchers worked to establish a framework to understand and predict optimal temperature setpoints at the room level and take into consideration a host of internal factors like occupancy fluctuations and external factors such as forecasted weather or the carbon intensity of the grid. This allowed the existing systems to heat and cool more efficiently, all without manual intervention. Thanks to staff support to ready buildings for the new technology, the program aims to add additional campus buildings to the AI control platform as soon as the pilots are complete.

total emissions year over year

Increasing GHG Accounting Work
FY2023 marks the first year that MIT has calculated emissions from off-campus sites. This data from Bates Research and Engineering Center, Haystack Observatory, and Endicott House provides a more complete picture of MIT’s emissions and the scope of work needed to mitigate these emissions. These off-site emissions will add approximately 3,000 MTCO2e to our campus footprint. Note:These emissions are NOT included in the total emissions reported this year relative to our 2014 baseline, but reported here separately.

Net Zero Reporting
The concept of net-zero emissions reflects an interim objective to balance an organization's current emissions with an equal volume of reductions achieved elsewhere. As MIT decarbonizes its campus, investments are simultaneously being made to enable new renewable energy projects that will reduce emissions regionally and accelerate the decarbonization of electricity grids.
 
MIT continues to report its full, on-campus emissions as well as the impact of its renewable energy purchases in both megawatt hours and equivalent greenhouse gas emissions avoided.  This allows for a transparent approach to reporting emissions performance. MIT reports each year its total gross campus emissions, as well as the total net campus emissions that includes the impacts of the renewable energy purchased. MIT's total emissions will be dynamic each year as we begin to include the impacts of off-campus facilities, business travel and commuting, and the volume of energy generated from solar and wind projects.

Summit Farms PPA
In 2023, through the purchase of 54,795 megawatt hours of solar power from Summit Farms, MIT offset 15,733 MTCO2E from on-campus operations. However, due to a major system-wide shut down at the solar facility that reduced production, the offset benefit to MIT was reduced 28 percent from the previous year. 

2022 GHG Update

The Path Toward 2050

Fast Forward: MIT’s Climate Action Plan for the Decade includes two major campus goals—a net-zero emissions MIT by 2026 and the goal of eliminating direct campus emissions by 2050. To meet the 2026 target, and ultimately achieve zero direct emissions by 2050, the Institute is making its campus buildings dramatically more energy efficient, transitioning to electric vehicles (EVs), and enabling large-scale renewable energy projects, among other strategies.

emissions defined by scope

Fiscal Year 2022 Update

Progress toward decarbonizing a dynamic campus like MIT highlights the often-non-linear path of reducing emissions. As the campus grows and needs evolve, emissions fluctuations are both expected and managed for, but the ultimate goal of a zero emissions MIT—and the work toward it—remains unchanged.  In fiscal year 2022, there was a 5% increase in total on-campus emissions over the previous year. In this same time, MIT’s solar power purchase agreement (PPA) in North Carolina enabled the Institute to offset 11% of its total on-campus emissions.  

The overall increase in energy demand on campus—and resulting increase in emissions—was driven in part by a repopulation of campus, new campus growth (related to the New Vassar, the MIT Museum, expansion of Building 4, and reopened Hayden Library), pandemic related safety measures, such as higher building ventilation rates, and testing energy required for the new central plant commissioning. In addition, less solar energy was produced through our North Carolina solar PPA in fiscal year 2022, contributing to an increase in MIT’s total net emissions. MIT continues to focus on reducing direct energy use and the resulting emissions as the campus transforms and grows to meet the mission of the Institute.  

This year MIT committed to its fourth, multi-year partnership agreement with local utility company Eversource. The program—known as Efficiency Forward—was designed in 2010 to create an enhanced energy efficiency incentive program, creating a win-win situation where MIT could invest in more energy conservation projects and lower energy consumption on campus. Since its inception, the program has executed nearly 300 projects for a total calculated savings of approximately 70 million kilowatt hours and 4.2 million therms, playing a key role in MIT’s goal to reduce overall carbon emissions.
 

Despite a 7.5 percent increase in MIT’s campus building space since 2014 (equivalent to growth of 1 million gross square feet) the Institute reduced campus emissions over the same period by 5 percent via building energy retrofits and other efficiency measures, fuel switching from oil to natural gas and grid improvements. Including the impacts from solar energy purchases, MIT has reduced its net emissions by 15 percent since 2014. 

a pie chart showing emissions sources in different colors

Building Energy Efficiency 

Current efficiency efforts focus on reducing energy use in 20 buildings that account for more than 50 percent of MIT’s energy usage. One such project underway is Building 46—home to MIT’s brain and cognitive sciences research—one of the largest energy users on campus. Efforts include optimizing ventilation systems to significantly reduce energy use while improving occupant comfort and working with lab managers to implement programs such as fume hood hibernation and equipment adjustments. For example, by raising ultralow freezer set points by 10 degrees users can reduce their energy consumption by as much as 40 percent and not compromise performance. Together, these measures are projected to yield a 35 percent reduction in emissions for Building 46 and contribute to reducing campus-wide emissions by 2 percent.

Getting to Net-Zero with Renewable Energy Projects

Building on the success of the 2016 Summit Farm Power Purchase Agreement (PPA) that enabled the construction of a 650-acre, 60-megawatt solar farm on fallow farmland in North Carolina, MIT continues to advance collaborative opportunities to enable the development of new, largescale renewable energy projects and accelerate the de-carbonization of regional electricity grids. In 2022, through the purchase of 76,406 megawatt hours of solar power from Summit Farms, MIT offset over 22,000 metric tons carbon dioxide equivalent (MTCO2E) from on-campus operations.

Visualizing Scope 3 Emissions to Drive Change

The MIT Office of Sustainability has been working in partnership with researchers and staff alike, to capture a more complete picture of indirect, or Scope 3, emissions involved in operating the Institute such as purchased goods and services, MIT-sponsored travel, commuting, waste, and capital goods.


2021 GHG Update

Moving Towards a Net-Zero Campus By 2026

In 2021, MIT’s greenhouse gas (GHG) emissions remained relatively flat, with emissions rising approximately 2% from 2020 levels. This slight increase was driven in part by the addition of new buildings and pandemic-related building safety measures that ultimately required higher energy consumption. However, these higher emissions were offset through building-level energy efficiency investments, operational efficiency of the Central Utilities Plant (CUP), and improvements in the New England regional electricity grid. Since 2014, MIT has reduced its net emissions by approximately 22%. Of that net reduction achieved to date, approximately 13% is attributed to our solar power purchase agreement, 8% to on-campus mitigation measures, and less than 1% to carbon improvements to the local electricity grid. This sets MIT on the path toward the newly announced 2026 goal of net-zero emissions.

Image of bar chart of campus emissions over the years


campus emissions source chart


Sources of Reduced Emissions

In FY21, MIT realized a net increase of approximately 3,400 metric tons of GHG emissions from the previous year. This net change was driven by several primary factors as highlighted below. 


illustrated number sources


While the Institute continues to assess the ongoing impact of the pandemic on our campus energy use and greenhouse emissions, a few data trends have emerged. Since the campus significantly reduced its occupant density in early 2020:

  • At the building-level, electricity use on campus declined slightly with fewer people using electricity in offices, labs, and residences. However, natural gas use increased slightly to meet the higher building ventilation rates activated to reduce COVID-19 risk.

  • In addition, campus added new buildings including the commissioning of the expanded central utility plant, which contributed a net increase of emissions. However, growth was offset with the completion of several building energy efficiency projects and increased optimization of plant operations.

MIT Commits to Net-Zero Emissions by 2026 and Elimination of Direct Emissions by 2050

In 2021, the Institute launched Fast Forward: MIT’s Climate Plan for the Decade, which accelerates MIT’s commitment to innovate climate change solutions. The plan calls for MIT to achieve net-zero campus emissions by 2026 and to eliminate direct emissions by 2050. To advance these goals, the plan establishes several targeted strategies including investing in large-scale, off-site renewable energy and carbon reduction projects; transitioning to an electrified campus vehicle (EV) fleet and doubling EV charging infrastructure; scaling up on-campus solar photovoltaic capacity; incorporating and offsetting key Scope 3 emission sources; advancing climate resiliency planning; and expanding the boundaries of MIT’s greenhouse gas inventory to include most MIT-owned facilities outside of Cambridge.

Central Plant Renewal & Expansion Nears Completion

In 2021, the expanded and renewed Central Utilities Plant became operational, including system testing and commissioning, ushering in a new phase of efficient, on-campus distributed power generation. Once fully commissioned, the state-of-the-art, tri-generation plant is expected to reduce MIT’s annual emissions by approximately 10% annually. Additional investments in converting steam distribution systems to hot water systems continued in 2021. The testing and commissioning of the new plant equipment required the short-term additional use of natural gas, which increased our emissions by approximately 1,000 MTCO2e.

Summit Farms Solar Facility

MIT continued to benefit from the Institute’s 25-year commitment to purchase electricity generated through its Summit Farm Power Purchase Agreement (PPA). The agreement was established in 2016 and enabled the construction of a roughly 650-acre, 60-megawatt solar farm on fallow farmland in North Carolina. Through the purchase of 87,073 megawatt hours of solar power in 2021, MIT offset over 27,000 MTCO2e from on-campus operations in 2021.

Progress towards MIT's Greenhouse Gas Goal 2021

2020 GHG Update

With campus as a test bed, climate action starts and continues at MIT

Recap for 2020

In 2020, MIT continued to advance toward its goal of a minimum 32% reduction in greenhouse gas (GHG) emissions by 2030. Overall net emissions are now 24% below MIT’s 2014 baseline, with emissions on campus reduced 6% over the previous fiscal year. This reduction was driven in part by gains in building-level energy efficiency investments, operational efficiency of the Central Utilities Plant (CUP), improvements in the New England regional electricity grid, a less intense heating season, and a temporary de-densification of campus due to COVID-19.

Campus Sources of Greenhouse Gas Emissions

MIT Campus Greenhouse Emissions Trend

Sources of Reduced Emissions

In FY20, MIT realized a net reduction of nearly 11,000 metric tons of GHG emissions from the previous year. These net changes were driven by several primary factors as highlighted below. Preliminary efforts to develop data on the Institute’s Scope 3, or indirect, GHG emissions continue. This data will inform MIT’s total GHG emissions activities and enable MIT to explore opportunities to reduce emissions beyond what is currently being tracked.

Download the 2020 GHG Summary Report

2019 GHG Emissions

MIT continues to track toward its minimum 32% reduction goal by 2030 

Recap for 2019

In 2019, MIT continued to advance toward its goal of a minimum 32% reduction in greenhouse gas (GHG) emissions by 2030. Overall net emissions are 18% below our 2014 baseline as on-campus greenhouse gas emissions increased slightly from 2018 levels. This 2% increase in 2019 was in part driven by growth in campus size—including the first fully operational year for MIT.nano—local weather, and the use of specialty research gases. Investments in energy efficiency projects offset a portion of the growth in energy demand.

Innovating for GHG Mitigation 

MIT is home to numerous lab facilities where energy consumption is typically high due to the conditioning of outside air for ventilation purposes, coupled with high air change rates. MIT is currently exploring the development of an innovative laboratory ventilation procedure program to minimize energy consumption while also ensuring the safety and integrity of lab experimentation. The use of specialty gases in research across campus contributes a small yet potent  source of greenhouse gas emissions at MIT. As MIT.nano is expected to use substantial amounts of these gases, the research facility is testing a new system to neutralize these emissions through abatement solutions at point of use — reducing emissions and providing a model for altering the emissions potential of similar research and manufacturing facilities around the world.

Summit Farms Solar Facility 

MIT continued to benefit from the Institute’s 25-year commitment to purchase electricity generated through its Summit Farm Power Purchase Agreement (PPA). The agreement has enabled the construction of a roughly
650-acre, 60-megawatt solar farm on fallow farmland in North Carolina. Through the purchase of 87,300 megawatt hours of solar power, MIT was able to offset over 30,000 metric tons of greenhouse gas emissions (MTCO2e) from our
on-campus operations in 2019. The Summit Farms PPA model has been credited with inspiring a number of similar projects around the country putting additional renewable energy onto the power grid.

Energy Efficiency

As MIT explores strategies for achieving climate neutrality in the future, a core component continues to be scaling up campus energy efficiency. Anchored by significant planned efficiency gains from MIT’s new central utility plant, the Institute is implementing new complementary approaches to increase energy efficiency gains in buildings ranging from testing artificial intelligence to optimize building control systems, to wholesale mechanical system changes in labs to reduce air change requirements creating a more efficient and comfortable work environment.

Download the 2019 GHG Summary Report

2018 GHG Inventory

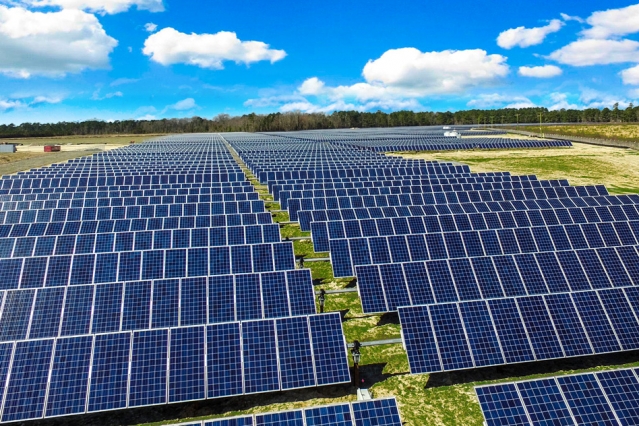
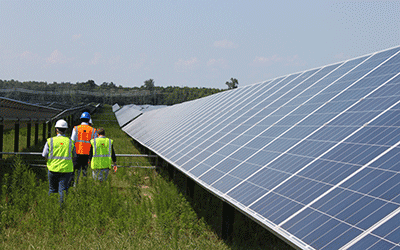
Solar energy purchase contributes to progress toward goal

Recap for 2018

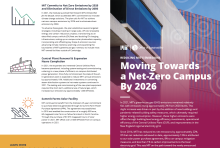
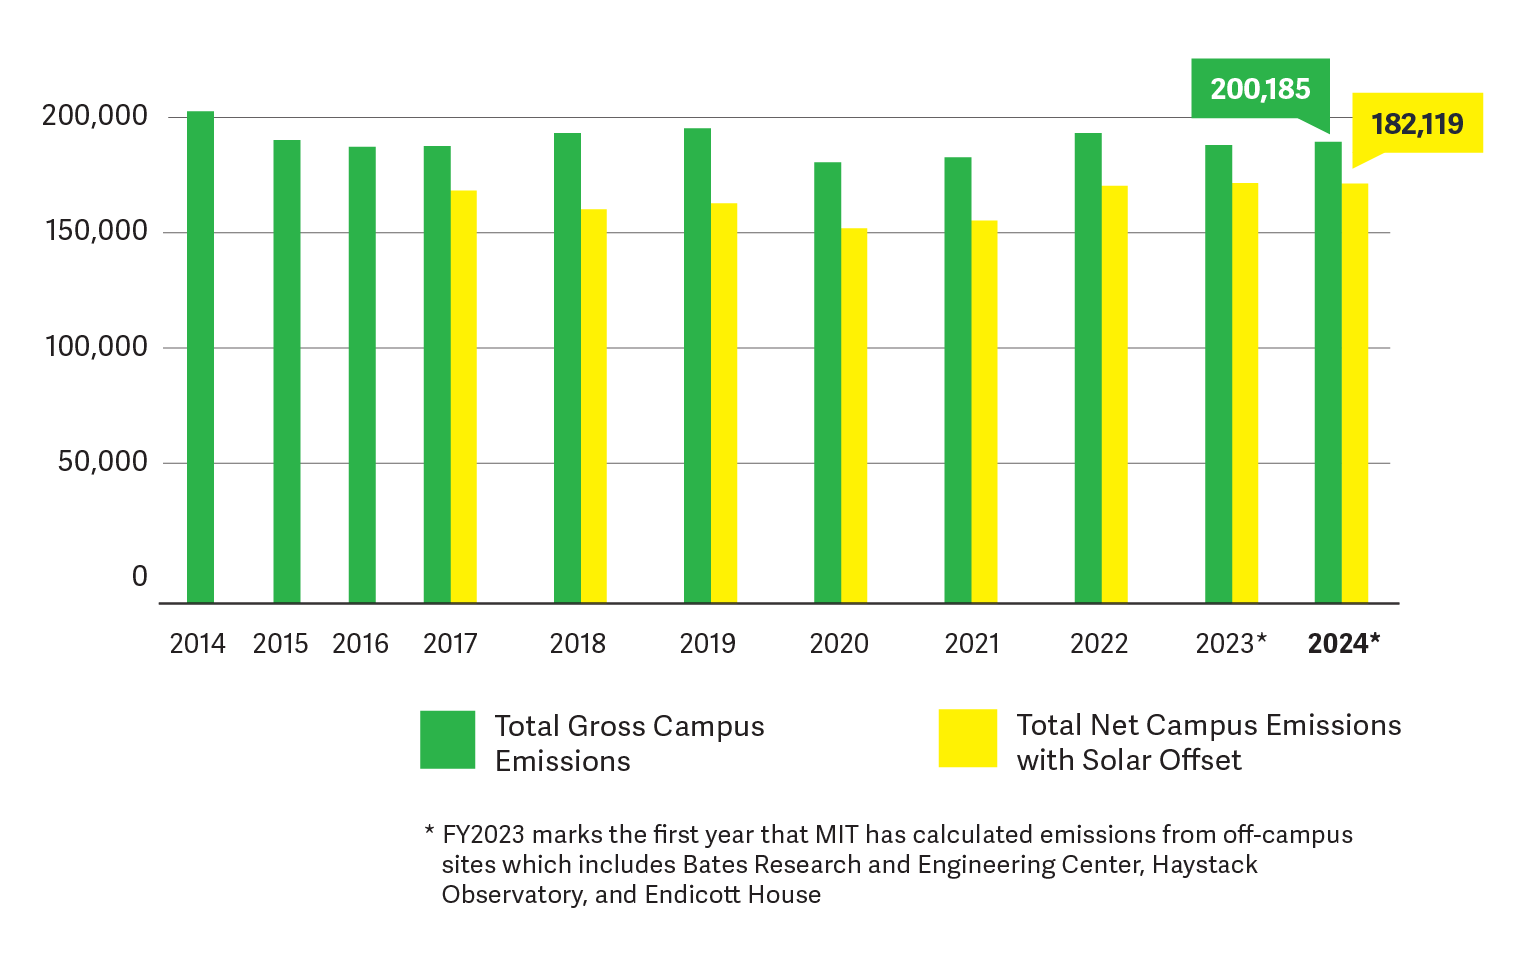
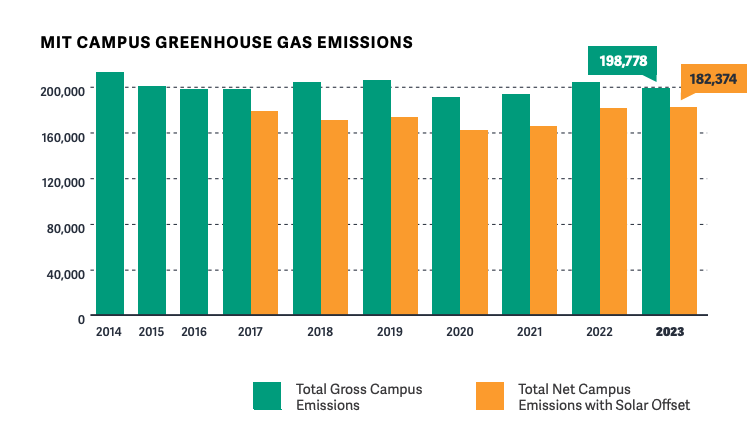
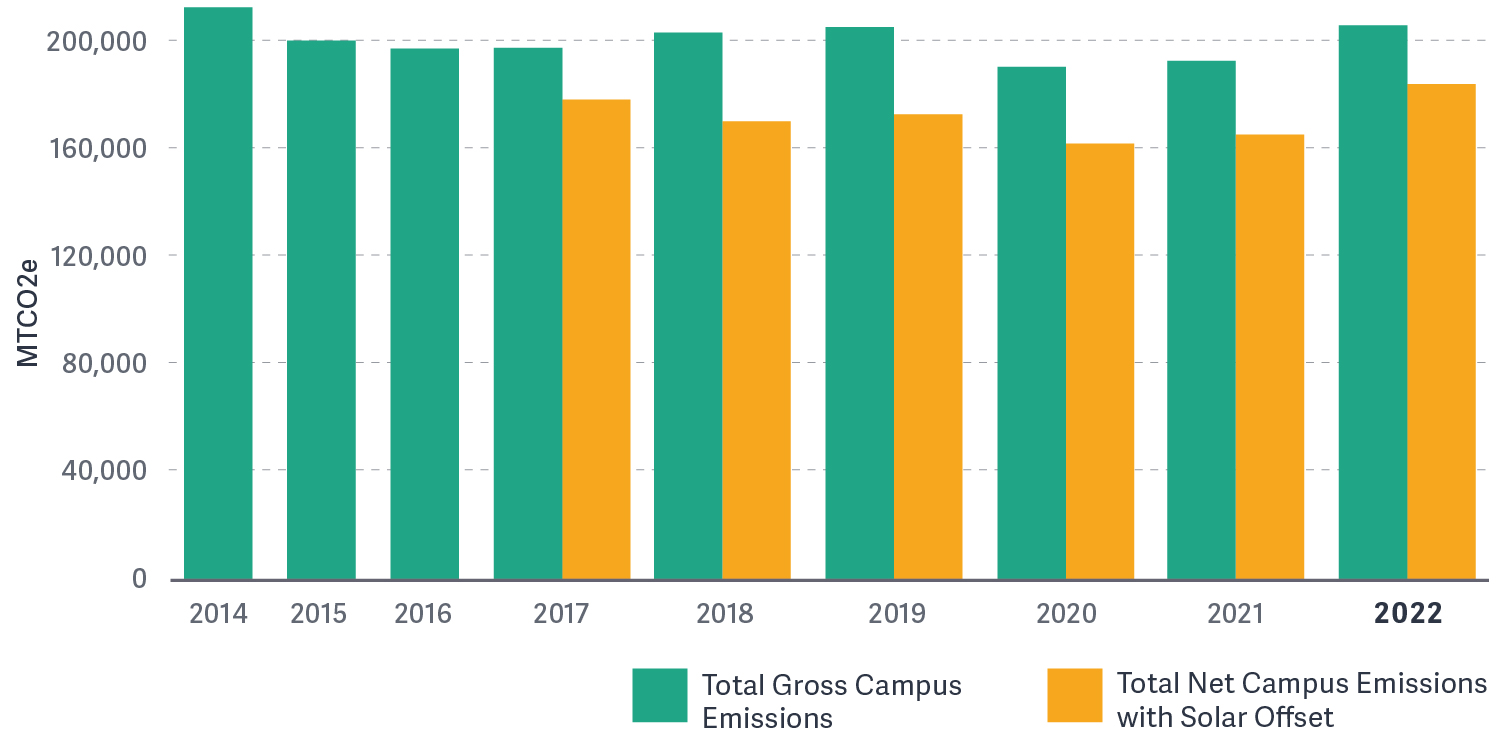
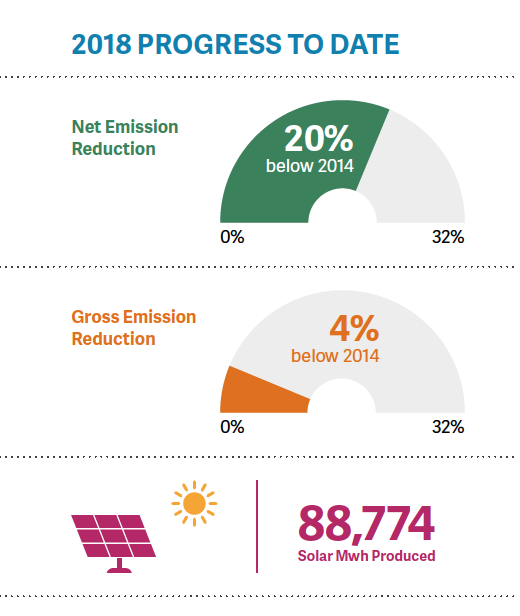
MIT continues to advance towards its 2015 goal of a 32% reduction in campus greenhouse gas emissions by 2030. Compared to 2017, net emissions, which account for the offset by the solar power purchase, have fallen 4.5%, bringing the total net emissions reduction to 20% below our 2014 baseline. Although on-campus gross emissions (which do not account for the solar energy purchase) increased 3% from 2017 to 2018, these emissions have dropped a total of 4% since 2014. Read the MIT News story here for more insight into this progress.


2018 GHG progress to date

Solar energy purchase agreement update

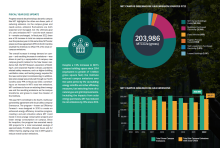
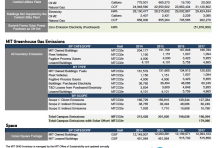
Through the solar energy purchase agreement, Summit Farms produced 88,774 megawatt hours for MIT in 2018, contributing a net carbon offset of 33,040 metric tons carbon dioxide equivalent (MTCO2e). The power purchase agreement partnership between MIT, Boston Medical Center and Post Office Square, continues to be viewed as an important and scalable multi-party model for other organizations.

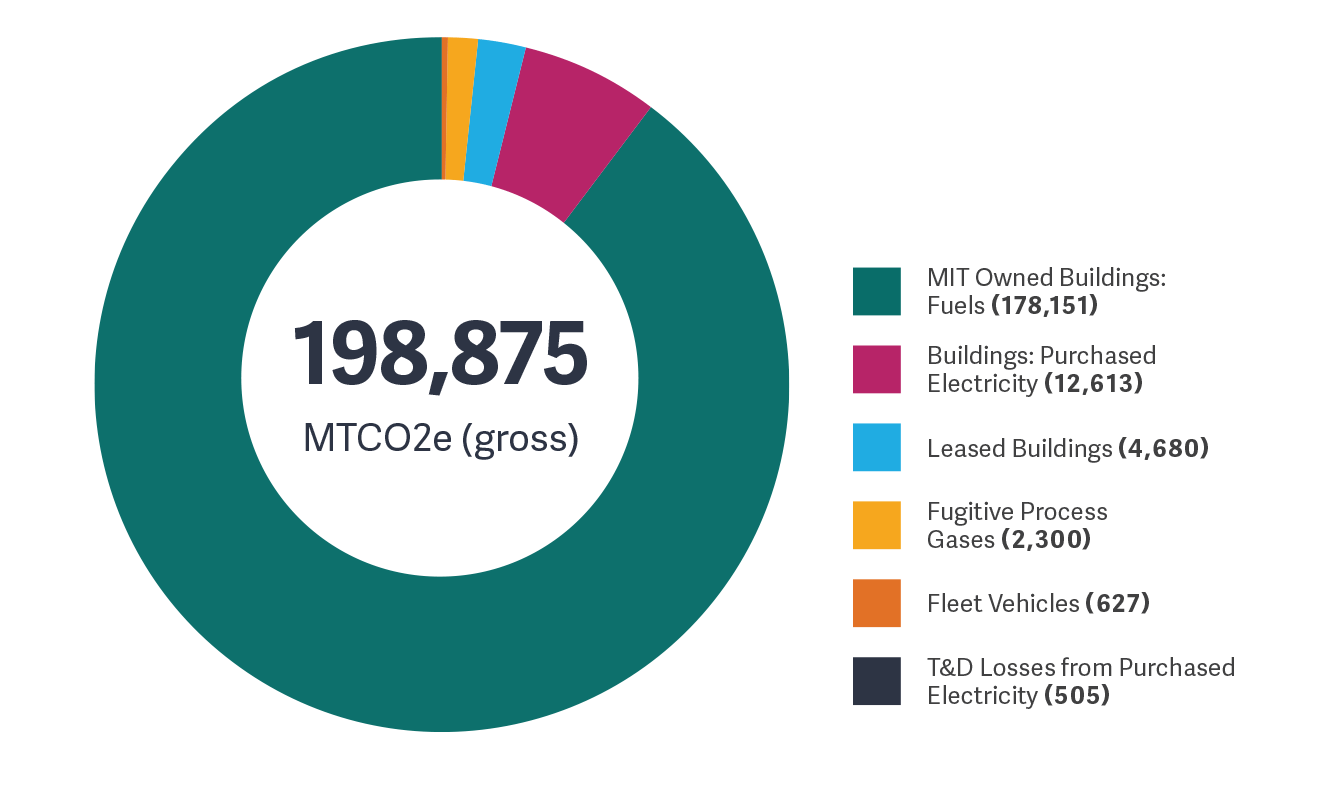
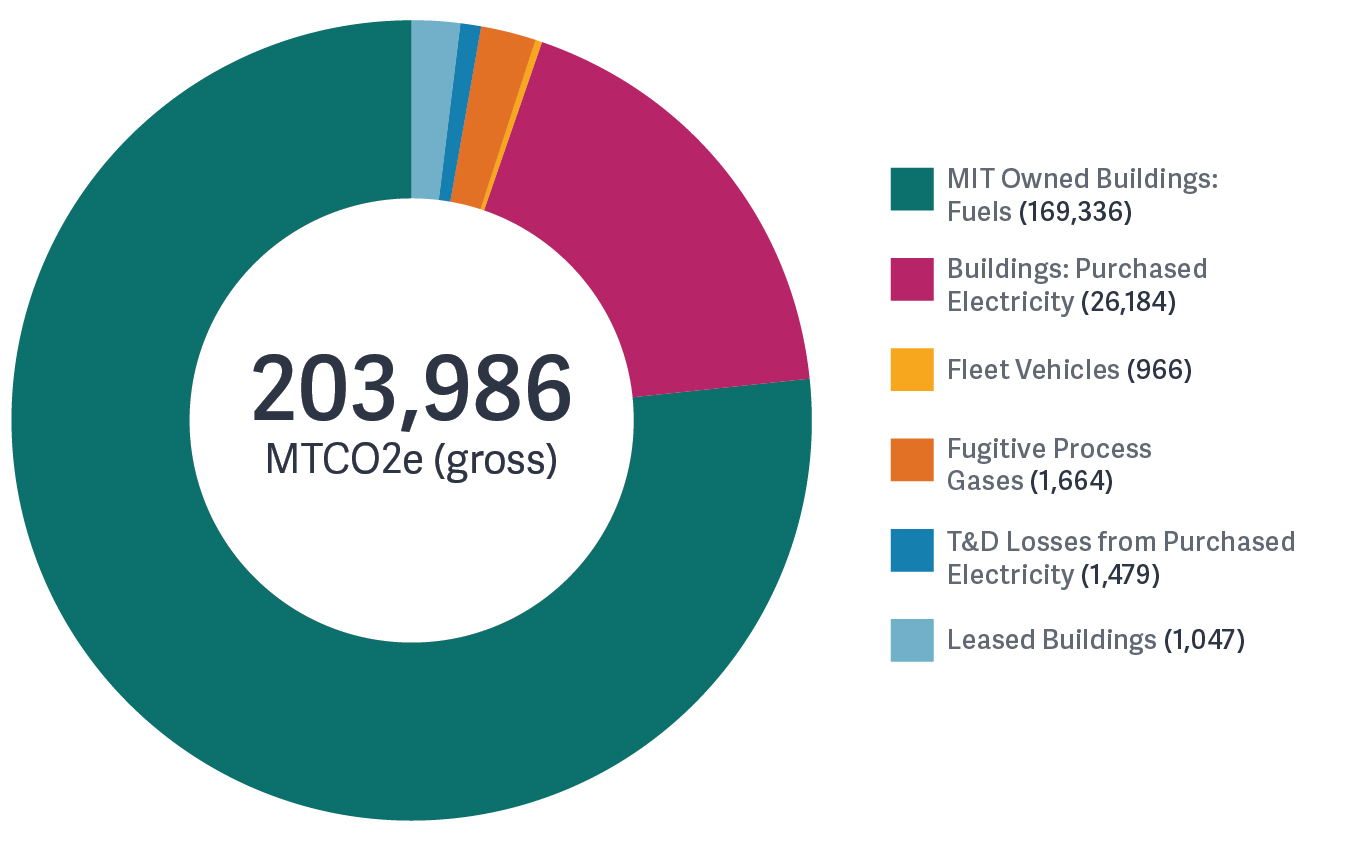
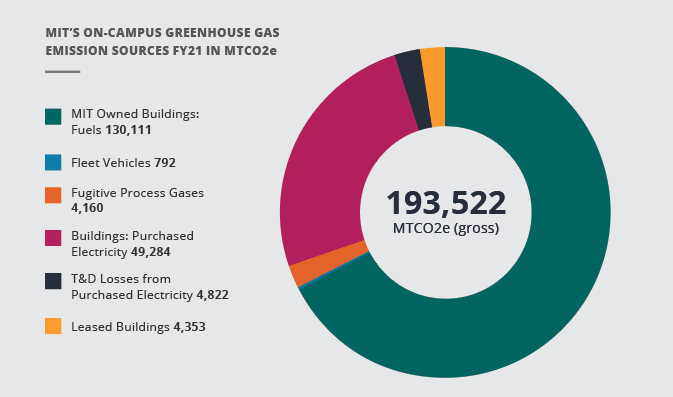
A deeper dive into the sources of MIT's emissions

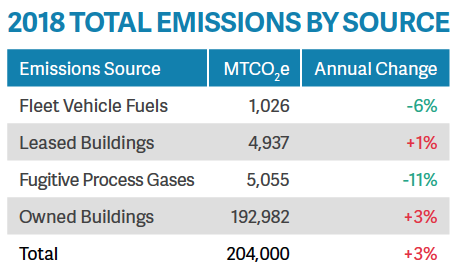
In 2018 the largest source of MIT's greenhouse gas emissions is associated with the energy to heat, cool, and power our buildings. This is followed by the use of specialty gases that are used in research and operations, and then emissions associated with leased academic space, emissions associated with the transmission and distribution losses of purchased grid electricity, and lastly, emissions from use of fuel in MIT's fleet of campus vehicles.


Emissions by source table

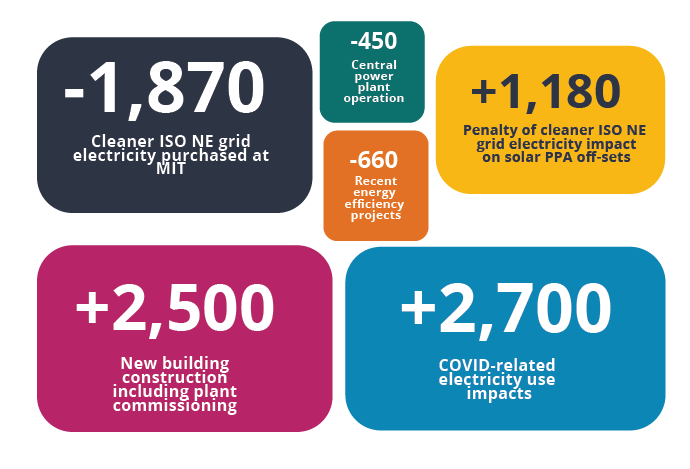
A note about gross campus emissions

In 2018, gross emissions from all on-campus sources grew slightly from the previous year. This can be attributed to a colder than usual winter, changes in efficiency within the central utility plant, and growth in energy use on campus including new construction. Since 2014, the size of MIT’s campus within the boundaries of our GHG inventory has increased by 2%. When emissions reductions resulting from MIT's purchase of solar energy are taken into account, MIT's net greenhouse gas emissions continued to decline. Read the 2018 GHG summary report below for more details.

Download the 2018 GHG Summary Report

2014 - 2017 GHG Inventory

A Look Back: 2014-2017

Each year, MIT measures the greenhouse gas emissions associated with the operation of our campus to better understand our direct contribution to the heat-trapping gases in the atmosphere – the gases contributing to global climate change. This basis informs our carbon reduction strategies and allows for tracking progress over time. In this section, you can explore emissions updates by year, from 2014 to 2017. For more recent yearly reporting, navigate using the tabs at the top of this section. 


MIT Greenhouse Gas Inventory 2014

MIT Greenhouse Gas Inventory 2015

MIT Greenhouse Gas Inventory 2016

MIT Greenhouse Gas Inventory 2017

MIT Campus Greenhouse Emissions


Supporting Resources
MIT Campus Greenhouse Gas Emissions Reduction Strategy

This first-of-its-kind report lays out the pathways and strategies that will guide the MIT administration in meeting or surpassing MIT's greenhouse gas emission reduction goal.

MIT GHG Inventory Overview

Each year, MIT measures campus carbon emissions to better understand our impact on the health of people and the environment, and to inform our carbon reduction strategy. The current inventory includes emissions in three areas: owned & leased buildings, fugitive gases, and campus vehicles.

Energize_MIT

A Plan for Action on Climate Change called for the development of an open energy data platform to support research and intelligent decision-making. The platform provides a curated series of interactive visualizations on campus and building-level greenhouse gas emissions and utility energy usage.

Methodology

Methodology

A greenhouse gas inventory assesses the quantity of greenhouse gases the Institute produces, and identifies the emissions’ sources. The MIT Office of Sustainability (MITOS) uses the Operational Control Approach as defined by the World Resources Institute’s GHG Protocol, the worldwide corporate and campus standard for greenhouse gas emissions measurement. The GHG Protocol defines emissions using three "scopes," which are detailed below along with the specific greenhouse gases measured. 

MIT currently measures emissions from owned & leased academic buildings, fugitive gases, and campus vehicles. The emissions from these activities are calculated using the Greenhouse Gas Protocol embedded in the original Campus Carbon Calculator — the most commonly used inventory tool for universities — which converts data into a single unit: metric tons of carbon dioxide equivalent (MTCO2e).

MITOS conducts and manages the annual inventories in collaboration with the Department of Facilities and the Environment, Health and Safety Office. The MIT Office of Treasury and Planning audits the findings for accuracy. MIT plans to expand the scope of its GHG inventory in the future and actively engage the academic and operational community in the use, refinement, and application of the inventory in order to reduce the carbon intensity of the campus.