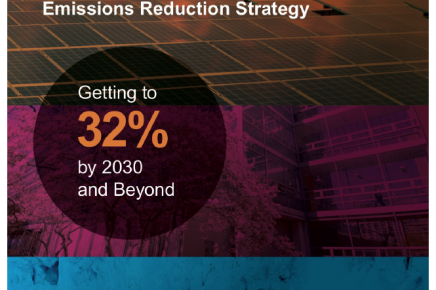
This first-of-its-kind report lays out the pathways and strategies that will guide the MIT administration in meeting or surpassing MIT's greenhouse gas emission reduction goal.
Each year, MIT measures the greenhouse gas emissions associated with the operation of our campus to better understand our direct contribution to the heat-trapping gases in the atmosphere – the gases contributing to global climate change. This basis informs our carbon reduction strategies and allows for tracking progress over time. In this section, you can explore emissions updates by year, from 2014 to 2017. For more recent yearly reporting, navigate using the tabs at the top of this section.
MIT Greenhouse Gas Inventory 2014
MIT Greenhouse Gas Inventory 2015
MIT Greenhouse Gas Inventory 2016
MIT Greenhouse Gas Inventory 2017
Each year, MIT measures campus carbon emissions to better understand our impact on the health of people and the environment, and to inform our carbon reduction strategy. The current inventory includes emissions in three areas: owned & leased buildings, fugitive gases, and campus vehicles.
A Plan for Action on Climate Change called for the development of an open energy data platform to support research and intelligent decision-making. The platform provides a curated series of interactive visualizations on campus and building-level greenhouse gas emissions and utility energy usage.


