Learn more about our methodology and performance since 2014.
Integrating renewable energy into our GHG footprint
Recap for 2017
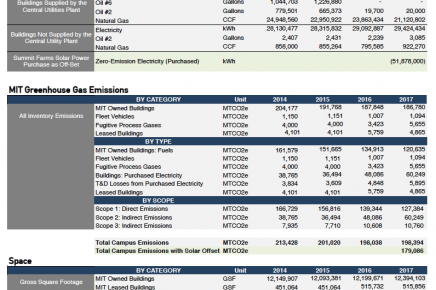
From 2014-2017, MIT reduced its greenhouse gas emissions by 16 percent, making considerable progress toward the goal of reaching at least a 32 percent reduction by 2030, as called for in the Institute’s Plan for Action on Climate Change. Read the 2017 MIT News story on the progress here.
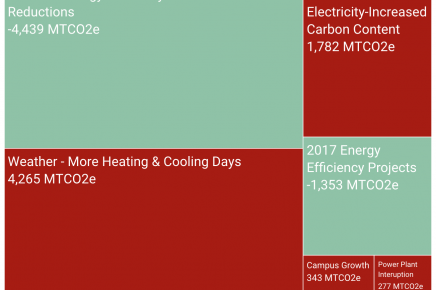
In FY2017, MIT’s greenhouse gas footprint has been reduced by 9% from 2016 levels primarily due to electricity produced via a solar power purchase agreement. MIT’s on-campus total emissions in 2017 were flat from 2016 levels. This is despite a growth in some campus emission sources combined with a colder winter, warmer summer and more carbon-intensive grid-purchased electricity.
2017 marked the first year MIT began to account for the impact of their large Summit Farm solar energy purchase. The newly developed Summit Farms solar farm began generating electricity for the North Carolina regional grid in November 2016; and through June 2017 produced 51,878 megawatt hours of power for MIT. It is expected that in a full-year of production, the solar farm will generate 107,000 megawatt hours of solar power for MIT.
Two additional milestones
The year 2017 saw the the launch of:
-
Energize MIT - our on-line energy and GHG data dashboard available to the MIT community – is calculating and displaying for the MIT community our academic building GHG performance on a monthly basis. These emissions comprise 94% of all the emissions we are tracking for our 2030 reduction goal. Explore this data at Energize MIT.
-
MIT's first greenhouse gas emissions reduction strategy report, reflecting implementation priorities for the next 3-5 years.

Summit Farms, an array of 255,000 solar panels occupying an area in North Carolina four times the size of MIT’s campus, is projected to generate 146 gigawatt-hours of emissions-free power per year, resulting in the local abatement of 119,500 metric tons of carbon dioxide emissions. This is the equivalent of removing almost 25,250 cars from the road. MIT's share of the power is equal to approximately 40% of MIT's total campus electricity use.
Download underlying energy and greenhouse gas data as an Excel spreadsheet.
Read about MIT's Greenhouse Gas Reduction Strategy in detail.
Learn more about drivers of changes in GHG emissions on campus.


